Personal Dashboard
Introduction
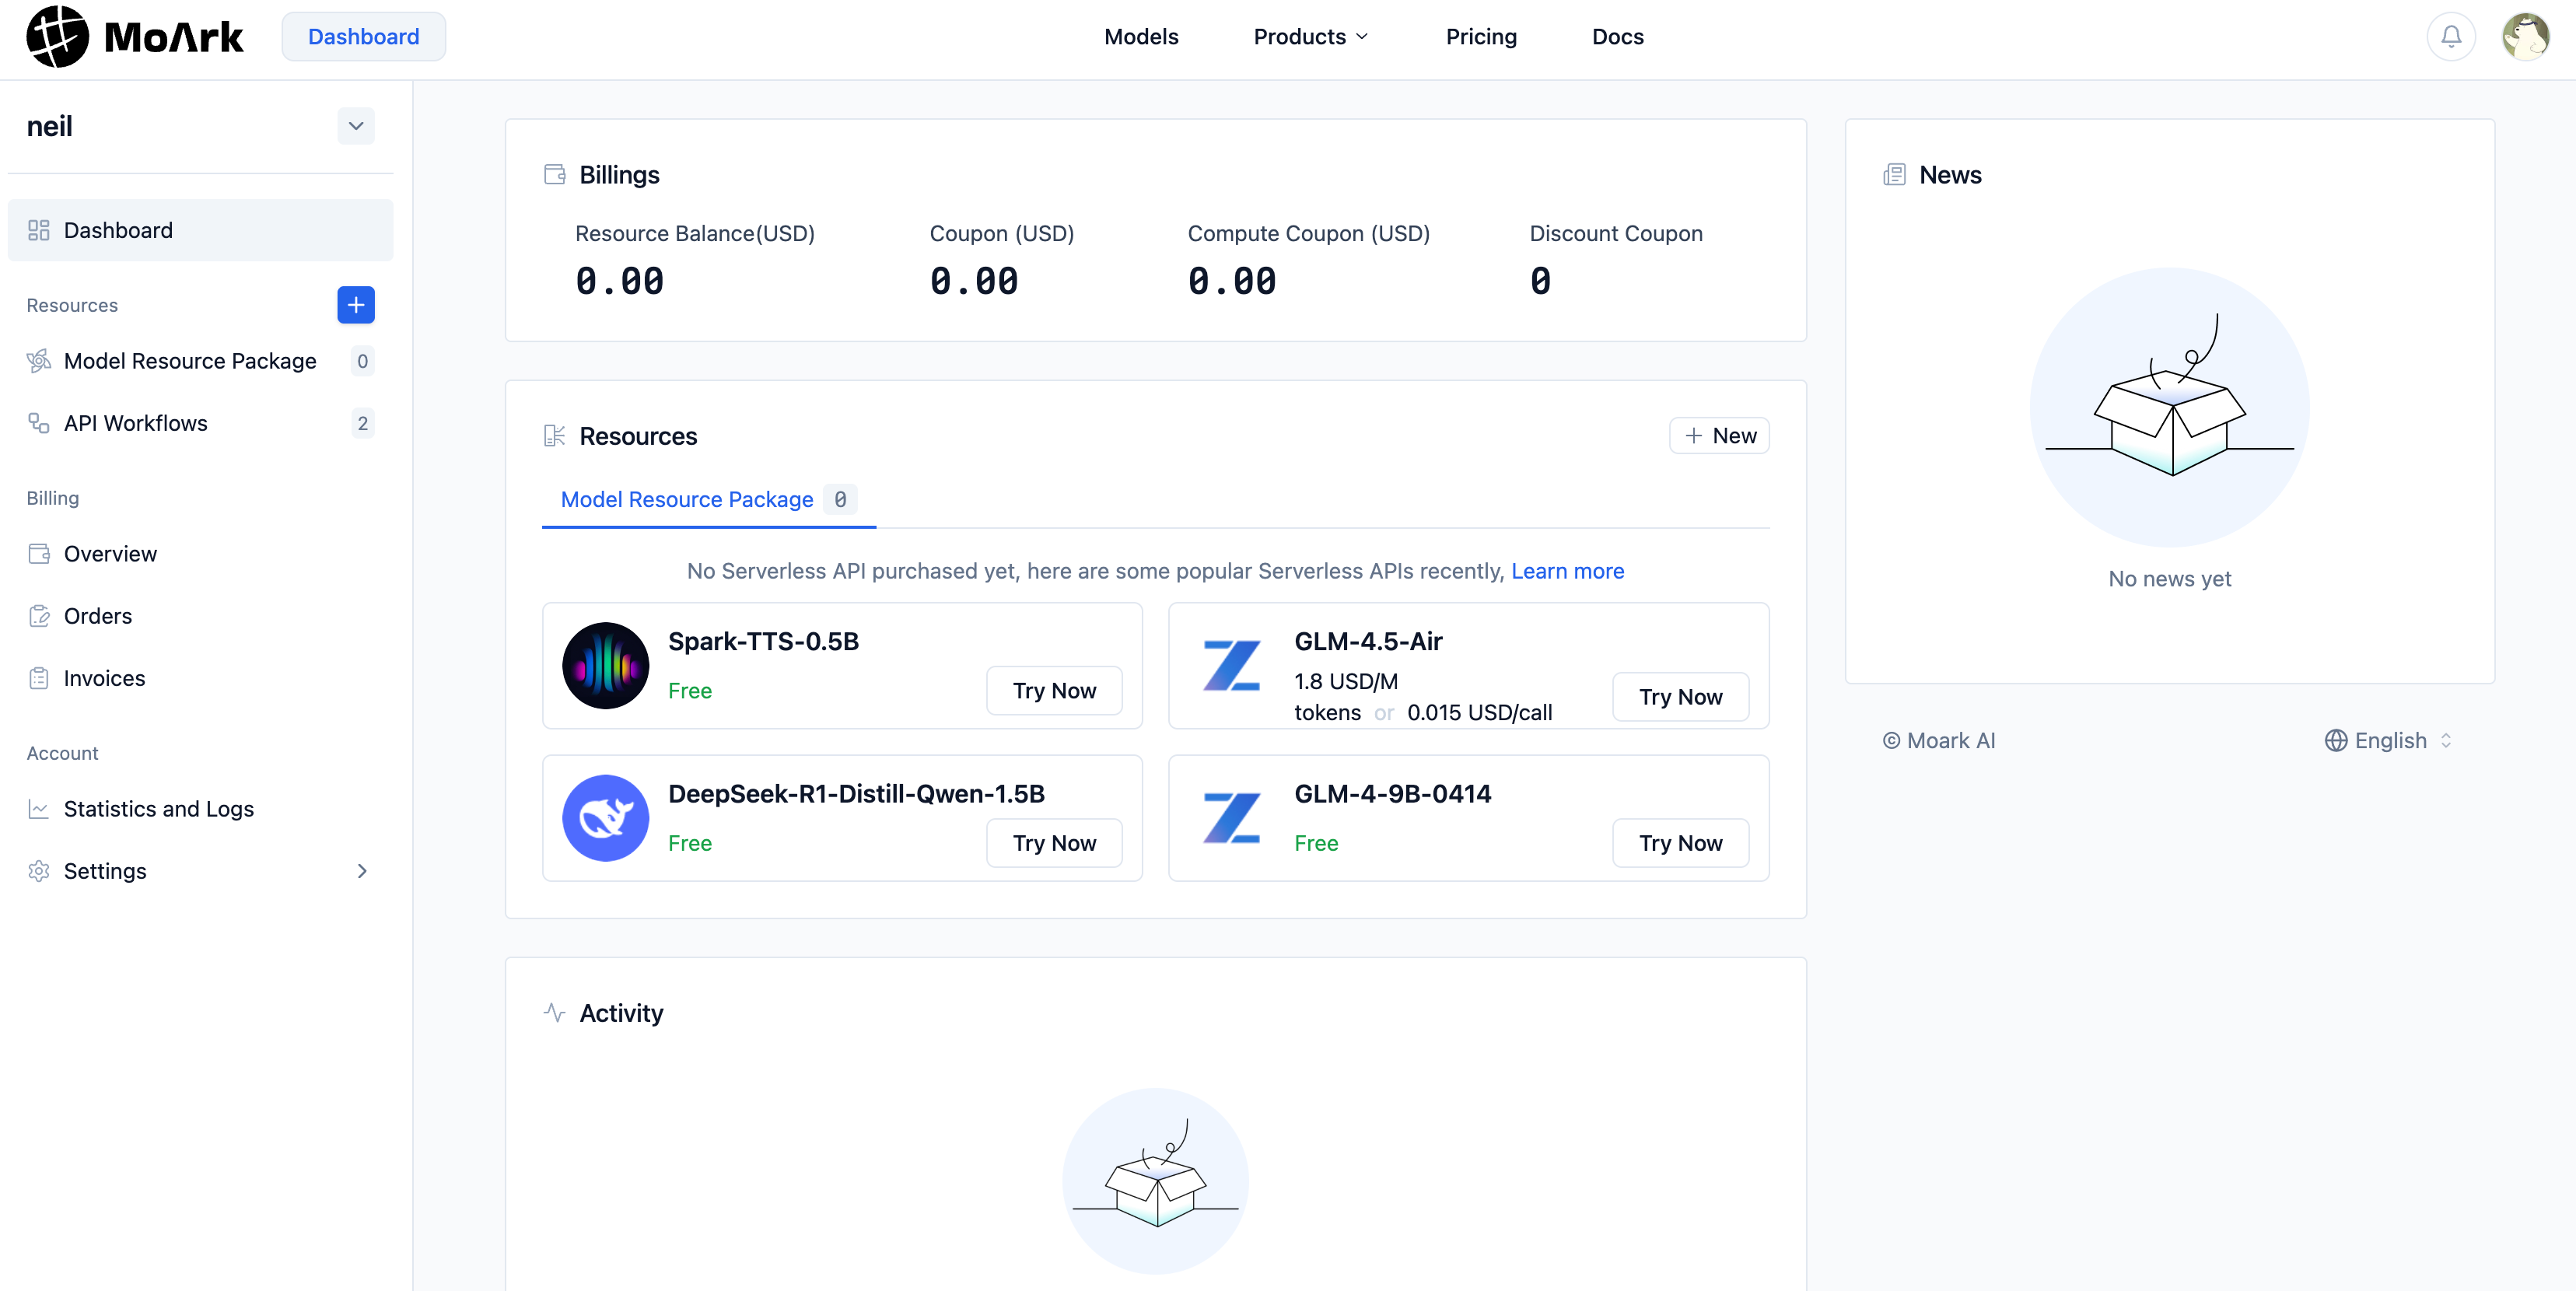
The Personal Dashboard is your core entry point for resource management, cost viewing, and functional operations on MoArk. It integrates multi-dimensional information and operation modules to facilitate efficient use of platform services.
After successful login, you will be automatically redirected to the dashboard interface. You can also click the MoArk LOGO or the dashboard button in the top navigation to enter the Personal dashboard interface. The dashboard interface integrates all core function entrances:
- Resource Management: Includes functions such as Serverless API, Model Engine, Applications, Model Fine-tuning, Models and Datasets, allowing you to browse/manage resources you have created or favorited.
- Cost Center: View account balance, order management, invoice management, and coupon usage.
- Settings Entrance: You can click the settings icon at the bottom of the left navigation bar or access the settings interface from the drop-down menu of the avatar in the upper right corner to configure personal information, access tokens, etc.
- Community Updates: Real-time push of the latest platform news, such as in-depth model analysis, free resource opening notifications, popular model online experiences, etc.
Personal Information Settings
Personal information is synchronized with your Gitee account in real-time and does not require separate maintenance:
-
After logging in, click the avatar in the upper right corner and select "Personal Settings" to enter the information page.
-
Editable content includes:
Basic Information: Name, avatar (synchronized from Gitee account).
Contact Information: Email (bound to Gitee account, used for receiving notifications).
Research Fields: Custom input to help the platform recommend relevant models and resources.
-
Click "Save" to update, and information changes will be synchronized to your Gitee account in real-time.
Personal Statistics and Logs
This module provides comprehensive data tracking of your MoArk resource usage, covering usage statistics and activity logs, helping you accurately grasp resource consumption and troubleshoot call issues.
Usage Statistics: Go to Dashboard > Statistics and Logs > Usage Statistics to view macro data statistics of Serverless API calls. You can quickly understand the distribution of core indicators of resource usage, identify frequently called and time-consuming resources, and provide data support for resource optimization and cost control.
Call Logs: Provide detailed behavior records of resource calls, support conditional filtering, accurately locate detailed information of each API call, and can be exported as CSV for auditing.